It was a Tuesday morning in late November 2025, and my phone rang before I’d even finished my first cup of tea. The operations manager at a large food and beverage processing facility in the East Midlands — I’ll call it Riverside Foods, though that’s not their real name — was practically frantic. Their centrifuge dewatering line had been struggling for weeks. Cake solids were dropping below acceptable levels, polymer consumption had crept up by nearly 30% over the previous quarter, and their effluent contractor was breathing down their necks about sludge volumes. On top of that, their environmental compliance officer had flagged potential issues with the new discharge consent conditions that came into force in early 2026. They needed someone on-site, fast.
I drove up the next morning. Three hours in the car, a thermos of coffee, and my battered sampling kit in the boot. When I walked into that plant, I knew within twenty minutes we were looking at a classic high-organic-load dewatering problem — the kind I’ve encountered dozens of times over the past three decades, and yet each one still teaches you something new.
The Background: 2026 Is Not a Forgiving Year for UK Food Plants
Before I get into the technical details of what we did, let me give you a bit of context, because the business pressures here are real and they matter to how you approach these jobs.
The UK food and beverage sector is under enormous strain right now. Energy costs, while slightly off their 2022–2023 peak, are still running at roughly double pre-pandemic baselines for many industrial consumers. And the regulatory landscape shifted significantly in early 2026 — tightened wastewater-treatment discharge standards under the updated Water Industry (Sewerage Undertakers) Regulations mean that suspended solids limits in trade effluent consents have been tightened at many sites, particularly for high-COD streams like those from dairy, meat processing, and beverage production.
Riverside Foods was producing a mixed waste stream — primarily from a bottling and ready-meal co-packing operation — with COD values typically running between 4,200 and 6,800 mg/L and suspended solids between 1,800 and 2,900 mg/L. Their biological treatment system was handling the bulk of it, but the resulting mixed biological and primary sludge was the headache. The sludge had high organic content, significant fat and oil carry-through, and variable protein loadings depending on the production schedule.
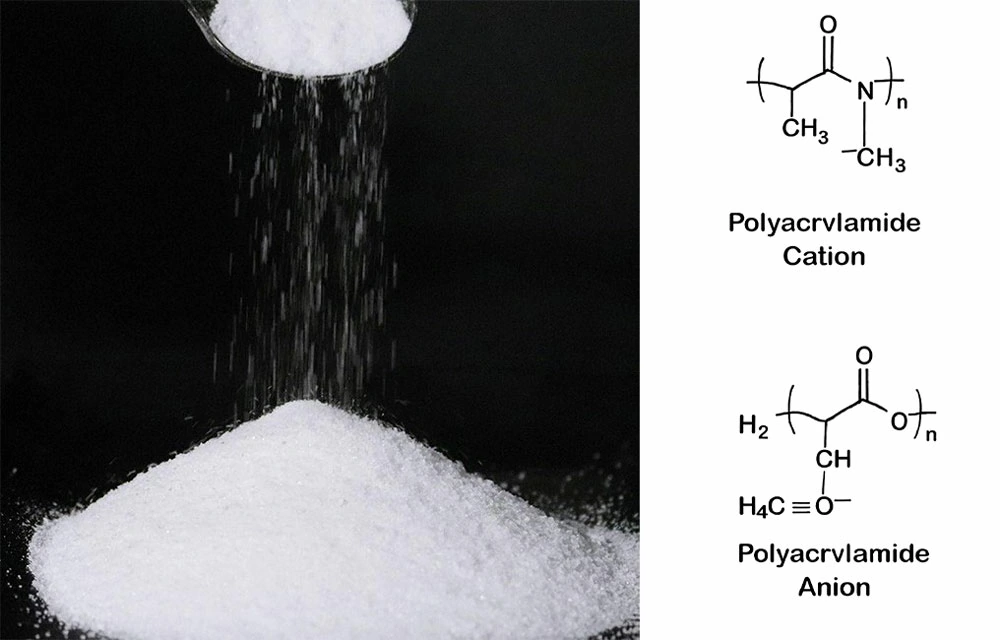
Their existing polyacrylamide flocculant programme — a medium-charge cationic product they’d been using for three years — had worked okay when throughput was lower. But as production ramped up in 2024 and early 2025, the sludge characteristics had shifted, and nobody had gone back to re-optimise the chemistry. Classic story. I’ve seen it dozens of times.
Why the Existing Product Was Failing: Understanding the Problem First
When I arrived on-site, the plant team had already done what a lot of operators do when results deteriorate — they’d just increased the dose. Understandable, but expensive and ultimately counterproductive.
The existing cationic PAM had an ionicity (charge density) of approximately 35–40% and a molecular weight in the medium range, roughly 10–12 million Daltons. For a straightforward municipal-style sludge, that’s often a reasonable starting point. But this wasn’t municipal sludge. The high fat, protein, and volatile organic fraction meant the surface charge dynamics of the floc particles were quite different.
I took fresh sludge samples from three points in the system — pre-thickener, post-thickener, and feed to the centrifuge — and we got them into the lab within four hours. That’s important. Stale samples give you stale answers.
The key observations from initial characterisation:
- pH: 6.8–7.2 (reasonably stable)
- Volatile Suspended Solids (VSS) as % of TSS: 72–78% — very high organic fraction
- Zeta potential: approximately -28 to -32 mV — indicating a moderately negative charge, but with significant variability between batches
- Capillary Suction Time (CST): 142–168 seconds — poor dewaterability baseline
That zeta potential range told me immediately that the existing product’s charge density was probably inadequate for this application. High-organic-content sludges, particularly those with significant protein and lipid fractions, tend to exhibit a more complex charge behaviour than purely inorganic or biological sludges. You often need a higher ionicity product to achieve adequate charge neutralisation before you can even begin to build meaningful floc structure.
Jar Testing: The Only Honest Way to Select the Right Product
This is where I want to spend some time, because jar testing is genuinely the cornerstone of everything we do in this field. I’ve met plant managers who’ve been talked into buying polymer programmes on the basis of a supplier’s datasheet and a phone call. In my experience, that’s how you end up in the situation Riverside Foods was in.
I’ve written more extensively about this elsewhere — if you want the full methodology breakdown, have a look at my piece on Why Jar Testing is the Foundation of Effective PAM Treatment — but let me walk you through what we did specifically here.
We screened six candidate cationic-polyacrylamide products across three key variable dimensions:
- Ionicity (charge density): 35%, 50%, and 65% cationic charge
- Molecular weight: Medium (10–12 MDa) and High (15–18 MDa)
- Physical form and dissolution rate: Powder (make-down at 0.2% and 0.5%) vs. emulsion (diluted to equivalent active polymer concentration)
For each product, we ran a standardised jar test protocol:
- 500 mL sludge sample in each jar
- Polymer solution added at dose rates of 4, 6, 8, 10, and 12 kg active polymer per tonne of dry solids
- Fast mix at 200 rpm for 30 seconds, slow mix at 40 rpm for 3 minutes
- Settle for 5 minutes
- Measure supernatant turbidity (NTU), floc structure (visual scoring 1–5), and collect cake for CST and pressure filtration test
The results were pretty clear, actually. Clearer than some jobs I’ve had, where you’re splitting hairs between two or three candidates.
The standout product was a high-molecular-weight (16.5 MDa), high-ionicity (60%) cationic PAM in emulsion form.
At an optimal dose of 7.5 kg active/tonne DS, it achieved:
- Supernatant turbidity: 38 NTU (vs. 210 NTU for the existing product at its best dose)
- Floc structure score: 4.5/5 — large, robust, well-drained floc
- CST: 48 seconds (down from 142–168 baseline — a massive improvement)
- Filtration test cake solids: 28.4% DS
The existing product, even at its optimal dose of 9 kg/tonne DS, was only achieving 19.6% DS in the filtration test and a CST of 112 seconds. The gap was stark.
Why did the higher ionicity make such a difference? In simple terms — and I apologise to any polymer chemists reading this who want a more nuanced answer — the higher charge density provided more effective neutralisation of the negatively charged organic colloids in the sludge. The high molecular weight then gave you the bridging and floc-building performance you need for efficient centrifuge dewatering. The emulsion form also gave us faster dissolution and more consistent polymer availability in the contact zone, which matters when you’re dealing with variable feed concentrations.
Implementation: Moving from Lab to Full Scale
Going from a jar test result to full-scale performance is never a straight line. I want to be honest about that. There’s always a translation factor, and there’s always a commissioning period where you’re chasing variables.
We phased the changeover over two weeks. The plant had a single Alfa Laval decanter centrifuge on the sludge dewatering line, running at approximately 12–14 m³/hour feed. We started with the new product at the lab-optimal dose equivalent — 7.5 kg active/tonne DS — and adjusted from there based on real-time cake solids measurements and centrate quality.
The first three days were slightly frustrating, if I’m honest. Cake solids were better than before — sitting around 22–23% DS — but not at the 28% we’d seen in the lab. We identified two issues: the make-down water temperature was too low (the emulsion polymer was viscous at 8°C and not fully activating before the contact point), and the dilution water flow rate was slightly high, reducing effective polymer concentration at the injection point.
We fitted a small inline heater to bring make-down water to 18–20°C and adjusted the dilution ratio. Within 48 hours, cake solids climbed to 26.5–27.8% DS — very close to lab performance. By the end of week two, we’d stabilised at 27.2% DS average, which was consistent and repeatable.
The Numbers: What This Actually Meant for the Business
Let me give you the before-and-after in plain terms, because ultimately this is what plant managers and finance directors need to see.
Before optimisation (Q3 2025 average):
- Cake solids: 18.5% DS
- Polymer consumption: 9.8 kg active/tonne DS
- Sludge to disposal: approximately 2,100 tonnes wet weight per year
- Annual polymer cost: £187,000
- Annual sludge disposal cost: £193,000
- Combined annual cost: £380,000
After optimisation (Q1 2026 average):
- Cake solids: 27.2% DS
- Polymer consumption: 7.5 kg active/tonne DS
- Sludge to disposal: approximately 1,430 tonnes wet weight per year (the same dry solids, but far less water — hence lower volume)
- Annual polymer cost (at new unit rate, slightly higher per kg but lower consumption): £159,000
- Annual sludge disposal cost: £138,000
- Combined annual cost: £297,000
Total annual saving: £83,000 — a 22% reduction in combined polymer and sludge disposal costs.
That’s a real number. Not a modelled projection. That’s actual invoices from Q1 2026 compared against Q3 2025 actuals, adjusted for throughput volume. The payback on the consultancy and switchover cost was under three months.
The centrate quality also improved significantly — suspended solids in the centrate dropped from an average of 1,840 mg/L to 420 mg/L, which reduced the load returning to the biological treatment system and improved overall effluent quality at the discharge point. That’s the compliance benefit that made the environmental team very happy indeed.
A Word on What Can Go Wrong: My Own Cautionary Tale
I wouldn’t be doing you any favours if I pretended every job goes this smoothly. Let me tell you about a project from about four years ago — a meat processing plant in Yorkshire — where I learned a hard lesson about assuming ionicity.
On that job, I made an error of judgement in the jar testing phase. The sludge characteristics suggested a moderate-ionicity product (around 45–50%) would be adequate. The lab results were promising. But I didn’t adequately account for the fact that this plant was running a high-temperature rendering operation that was significantly elevating the fatty acid content of the sludge on certain production days.
We went to full scale with the 48% ionicity product. On standard production days, it performed well. But on rendering days — which happened three to four times per week — the high lipid loading completely overwhelmed the charge neutralisation capacity of the polymer. Floc structure collapsed. Centrate turbidity spiked. The plant manager, quite rightly, was furious.
We had to go back, do supplementary jar testing with the rendering-day sludge specifically, and ultimately move to a 62% ionicity product as a compromise that performed acceptably across both operating modes. The whole exercise cost an extra six weeks and a significant amount of trust. I’ve never since run jar tests without specifically asking: “What does your worst-case sludge look like? Not your average. Your worst.”
It’s a lesson I carry with me on every project. And it’s part of why the Cationic PAM for Sludge Dewatering selection process needs to be treated as a genuine scientific exercise, not a catalogue order.
The Political Dimension: Why I Care About This Beyond the Invoice
I appreciate this might seem like an odd section in a technical article. But bear with me for a moment.
When I stood as the Labour candidate for Portsmouth South — both in 2015 and 2017 — one of the commitments I made on the doorstep, again and again, was around water quality and industrial pollution. Portsmouth Harbour had real issues with combined sewer overflows and industrial effluent. Residents knew it. They could smell it on certain days. And I made a specific promise that if elected, I’d push hard for tighter trade effluent standards and better enforcement.
I didn’t win. But those conversations — with fishermen, with parents worried about their kids swimming at Southsea beach, with the volunteers who cleaned up the foreshore every spring — those conversations never left me. When I eventually transitioned out of frontline politics and into environmental consultancy, I brought that sense of obligation with me. Every time I help a food plant cut its sludge volumes and improve its centrate quality, I feel like I’m delivering on a version of that promise, just from a different angle.
Wastewater-treatment isn’t glamorous work. Nobody’s writing headlines about polymer optimisation. But the cumulative effect of thousands of industrial sites doing it better — using pam-flocculant programmes properly matched to their actual sludge chemistry, rather than just running whatever the last supplier sold them — that has a real and measurable impact on UK waterways. I believe that genuinely.
What About Anionic PAM? A Note on the Broader Picture
One question the Riverside Foods team asked me during our review was whether there was a role for anionic products anywhere in their treatment chain. It’s a fair question, and the answer is: sometimes, yes — but not in sludge dewatering for high-organic-load streams like theirs.
Anionic polyacrylamide products have an important role in industrial wastewater-treatment, particularly in clarification stages and in certain industrial process applications. I’ve covered some of those applications in more detail in my piece on Anionic PAM in Industrial Wastewater. For Riverside Foods, the biological sludge characteristics — that strongly negative surface charge — meant anionic products would actively work against flocculation rather than supporting it. The sludge-dewatering application almost always calls for cationic charge, the question is just how much.
Key Takeaways for Other Food & Beverage Sites
If you’re running a food or beverage processing operation and you haven’t reviewed your sludge-dewatering polymer programme in the last 12–18 months — particularly if your production volumes or product mix have changed — I’d strongly encourage you to do so. Here’s what I’d focus on:
- Don’t assume your existing product is still the right one. Sludge chemistry changes as production changes. What worked in 2023 may be significantly suboptimal in 2026.
- Run proper jar tests, not just dose optimisation. Test across ionicity range and molecular weight range. It takes a day in the lab but can save you tens of thousands per year.
- Check your dissolution conditions. Temperature, dilution ratio, and contact time before the dewatering unit all have a significant impact on effective polymer performance. A great product badly dosed is a mediocre product at best.
- Measure cake solids consistently and frequently. This is your primary performance indicator. If you’re not measuring at least daily, you’re flying blind.
- Account for seasonal and operational variation. Your sludge in August is not your sludge in February. Your sludge on a heavy production day is not your sludge on a maintenance shutdown day.
The energy and compliance pressures facing UK food manufacturers in 2026 are not going away. The sites that will manage costs most effectively are those that treat their effluent and wastewater-treatment chemistry as a genuine optimisation opportunity, not just a necessary overhead to be minimised on the procurement spreadsheet.
Wrapping Up
The Riverside Foods project was, in many ways, a textbook case. Good baseline data, clear jar test differentiation, a disciplined commissioning process, and a measurable outcome. Not every project is this clean. But the principles hold even when the variables are messier.
A 22% reduction in combined sludge-dewatering and disposal costs. Centrate quality improved by nearly 77%. Compliance risk reduced. And a plant team that now has the knowledge and confidence to manage their polymer programme proactively rather than reactively.
That last point matters more than people realise. Capability transfer is part of what good consultancy does. I’m not interested in creating dependency. I want the Riverside Foods team to be able to run the next jar test themselves when production changes again — and to know what they’re looking at when they do.
If you want to go deeper on the methodology that underpins work like this — the systematic path from laboratory screening to real-world cost savings — I’d point you to From Jar Testing to Real Savings, which covers the full decision framework I use across different industry types and sludge compositions.
And if you’re dealing with a cationic-polyacrylamide selection problem, a dewatering efficiency issue, or just trying to make sense of a polymer supplier’s proposal before signing anything — feel free to leave a comment below or get in touch through the contact page. I’m not selling product. I’m not on commission from any manufacturer. I just help people get the chemistry right.
Thirty years in this field has given me a reasonable library of war stories. Some of them, like the Yorkshire rendering plant saga, I’d rather not repeat. Others, like Riverside Foods, are a reminder of why this work is worth doing.
The next article in this series will look at a quite different challenge — a municipal biosolids blending operation where the interaction between pam-flocculant selection and centrifuge G-force was creating some genuinely puzzling results. Spoiler: the polymer wasn’t the main problem. But that’s a story for another post.
Have you dealt with high-organic-load sludge dewatering challenges at your site? I’d be genuinely interested to hear what approaches have worked — or haven’t — in your context. Drop a comment below, or if you’d prefer a more direct conversation, use the contact form. No obligation, no sales pitch.